Before an organisation can decide what to do about its emissions, it has to measure them consistently. The GHG Protocol scopes are the framework almost everyone uses, and the boundaries are less obvious than the three-category summary suggests.
The Three Scopes
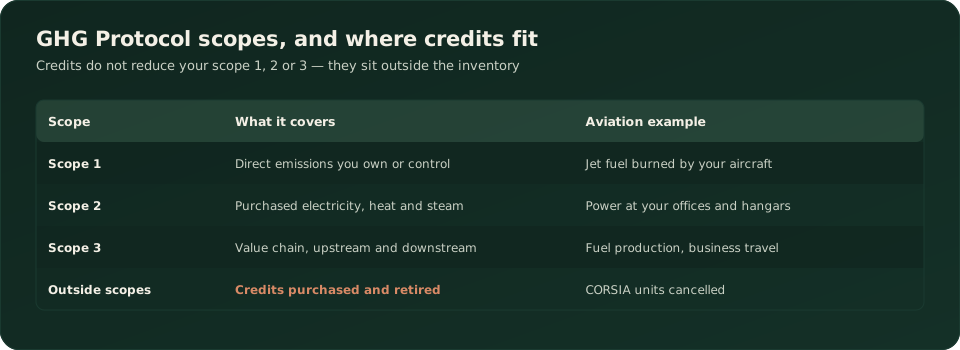
| Scope | Covers | Aviation example | Manufacturing example |
|---|---|---|---|
| Scope 1 | Direct emissions from sources you own or control | Jet fuel burned by your aircraft | Fuel burned in your boilers |
| Scope 2 | Indirect emissions from purchased electricity, heat, steam, cooling | Power at offices and hangars | Grid electricity for the plant |
| Scope 3 | All other indirect emissions in your value chain | Fuel production, business travel, waste | Purchased goods, logistics, product use |
Scope 1 and 2 are relatively tractable. You know what fuel you burned and what electricity you bought, and the data usually exists in systems you control.
Scope 3 is the hard one — and for most organisations it is also the largest, frequently several times scope 1 and 2 combined.
Why Scope 3 Is Difficult
It is divided into fifteen categories covering upstream and downstream activity: purchased goods and services, capital goods, fuel and energy activities not in scopes 1 and 2, transportation, waste, business travel, employee commuting, leased assets, processing and use of sold products, end-of-life treatment, franchises and investments.
Three structural difficulties:
The data is not yours. Scope 3 emissions occur in other organisations' operations. You depend on suppliers and customers for data they may not have, may not want to share, or may calculate differently.
Estimation is unavoidable. Where primary data does not exist, spend-based or activity-based factors are used. These are approximations, and two organisations with identical operations can report materially different scope 3 figures depending on the factors chosen.
Double counting across organisations is expected. Your scope 3 is somebody else's scope 1. That is intentional in the framework — it is not an error — but it means scope 3 figures cannot be summed across companies.
The practical consequence: scope 3 is directionally useful and precisely uncertain. Treating a scope 3 number as comparable between organisations, or as precise to a few percent, over-reads it.
Boundaries: The Decision That Shapes Everything
Before measuring anything, an organisation must set two boundaries, and the choices materially change the reported total.
Organisational boundary — which entities are included:
| Approach | What it captures |
|---|---|
| Equity share | Emissions in proportion to ownership stake |
| Financial control | 100% of entities you financially control |
| Operational control | 100% of entities whose operating policies you set |
Operational control is the most common choice and is generally what regulators expect, but the answer differs — a joint venture at 40% ownership contributes 40% under equity share and either 0% or 100% under a control approach depending on who controls it.
Operational boundary — which scopes and which scope 3 categories are included. Most organisations phase scope 3 in by category rather than attempting all fifteen at once.
Document both. A reported figure without a stated boundary cannot be interpreted or compared year on year, and a boundary change between years will look like an emissions change unless it is disclosed.
Where Carbon Credits Fit
This is the rule most often broken.
Credits are reported outside the scopes. They are never netted against scope 1, 2 or 3.
An organisation reporting "net scope 1 emissions after offsets" is misreporting under the GHG Protocol. The inventory reports what was emitted. Credits purchased and retired are disclosed separately, with their type, standard and quantity.
The reason is straightforward: netting destroys the information. A reader cannot tell whether an organisation reduced emissions or bought credits, and those are very different achievements.
The same applies to CORSIA specifically. Units cancelled to discharge a CORSIA obligation are a compliance action. They do not reduce the operator's reported scope 1 emissions, and they are not additionally available as a voluntary carbon neutrality claim.
Market-Based and Location-Based Scope 2
A subtlety that causes confusion.
Location-based scope 2 uses the average emissions intensity of the grid you draw from. It reflects physical reality.
Market-based scope 2 reflects contractual instruments — renewable energy certificates, power purchase agreements, green tariffs — that allocate specific generation to you.
The GHG Protocol requires both to be reported where market instruments are used. Reporting only the market-based figure obscures the physical position; reporting only location-based ignores procurement decisions that genuinely shift generation investment.
Note also that RECs and Guarantees of Origin are not carbon credits. They certify the attributes of generated electricity and cannot be retired against an emissions obligation. Conflating them is a common and consequential error.
Common Boundary Problems
Boundary decisions look administrative and produce most of the year-on-year comparability problems.
Acquisitions and disposals. Buying a business adds its emissions; selling one removes them. Neither is an environmental change. The convention is to recalculate the base year so the trend reflects performance rather than portfolio change, and to disclose that the recalculation happened.
Leased assets. Whether a leased building or aircraft falls in scope 1 and 2 or in scope 3 depends on the lease type and the consolidation approach chosen. Getting this wrong is common and can move material volumes between scopes.
Joint ventures. The treatment differs sharply between equity share and control approaches. A 50/50 joint venture may contribute half its emissions, all of them, or none, depending entirely on the approach and who holds operational control.
Franchises. Generally scope 3 for the franchisor, scope 1 and 2 for the franchisee — but the arrangement matters and the boundary should be stated.
Contractors and outsourced operations. Outsourcing an activity moves the emissions from scope 1 to scope 3. The atmosphere sees no change; the reported figure falls. Disclosing the reason matters, because an unexplained fall reads as a reduction.
The practical discipline: document the boundary and every change to it, and recalculate the base year when a structural change makes years incomparable. A trend line built across an unacknowledged boundary change is not a trend.
Getting the Data Right
The accounting framework is well documented. The difficulty in practice is data.
Name an authoritative source per figure. Fuel from the fuel system, electricity from meter readings or invoices, travel from the booking system. Where two sources disagree — and they will — write down which wins and why.
Document the emission factors used, with their source and version. Factors are revised, and a change in factor between years will look like an emissions change unless disclosed.
Distinguish measured from estimated. A scope 3 figure built from supplier-specific data is a different quality of number from one built from spend-based averages, and the disclosure should say which.
Keep the working. Someone will ask in three years how a figure was derived, and the person who prepared it will have moved on. This is the same discipline that makes CORSIA reporting survive verification — see CORSIA data systems.
Emission Factors: Where Precision Is Lost
Almost every figure in a GHG inventory is an activity number multiplied by an emission factor, and the factor is where most of the uncertainty lives.
Activity data — litres of fuel, kilowatt hours, tonne-kilometres — is usually measured and reasonably reliable.
Emission factors convert that into emissions, and they come from published databases, national inventories or supplier-specific calculations. Three things about them matter:
They are revised. National grid factors change annually as generation mixes shift. Using last year's factor for this year's electricity produces an error that looks like a performance change.
They vary by source. Two published databases can give different factors for the same activity, reflecting different underlying assumptions and system boundaries. Mixing sources within one inventory introduces inconsistency that is hard to explain later.
Spend-based factors are crude. Where scope 3 is estimated from expenditure rather than physical activity, the factor is an economy-wide average. It is directionally useful and it will not detect that you switched to a lower-carbon supplier, because the spend did not change.
The practical disciplines: document the factor source and version for every figure, use one source consistently within an inventory where possible, disclose when a factor revision rather than an operational change moved a number, and move from spend-based to activity-based factors in material categories as data allows.
An inventory where nobody can say which factors were used is an inventory that cannot be defended or compared.
Frequently Asked Questions
What is the difference between scope 1, 2 and 3? Scope 1 is direct emissions from sources you own or control; scope 2 is purchased energy; scope 3 is everything else in your value chain.
Which scope is largest? For most organisations, scope 3 — frequently several times scope 1 and 2 combined.
Do carbon credits reduce my scope 1 emissions? No. Credits are reported outside the scopes and are never netted against them.
Can I subtract offsets from my reported total? Not under the GHG Protocol. Report gross emissions and disclose credits separately.
What is the difference between market-based and location-based scope 2? Location-based uses grid average intensity; market-based reflects contractual instruments. Report both where instruments are used.
Are RECs carbon credits? No. They certify energy attributes, not tonnes of reduction, and cannot be retired against an emissions obligation.
How do I start on scope 3? Screen all fifteen categories for materiality, then measure the material ones properly rather than attempting all fifteen superficially.
Does scope 3 double count with suppliers? Yes, by design. Scope 3 figures cannot be summed across organisations.
Measuring, reporting or disclosing emissions and credits? DSTechnoverse works on the data side of carbon and environmental compliance — monitoring design, reconciliation, verification support and defensible reporting. See our CORSIA carbon credit services and data analytics. We are based in Indore, Madhya Pradesh and work across India and internationally.
Apply as a CORSIA buyer or seller
Talk to our team, or start with the complete carbon credits guide.